Project Highlights:
- 500 Lane kilometers
- 5 Collection days
- No traffic disruption


Founded in 1966, Tetra Tech is a leading global provider of consulting and engineering services, specializing in water, environment, infrastructure, resource management, energy, and international development. With over 28,000 employees across 550 offices worldwide, Tetra Tech leverages industry-leading technical expertise and sustainable approaches to deliver innovative solutions throughout the entire project lifecycle, from applied science and data analysis to engineering, design, and operations.

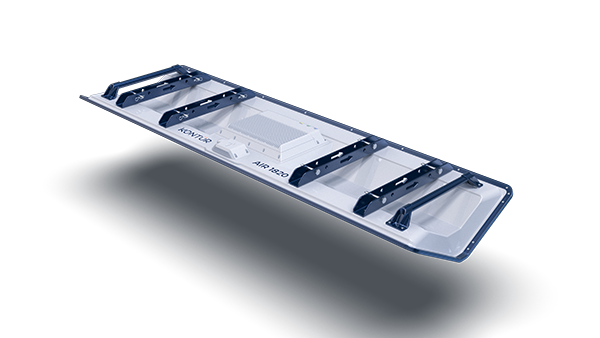
Tetra Tech used a Kontur Mk 4 AIR 3D Ground Penetrating Radar (GPR) system for non-destructive pavement assessment across approximately 500 lane kilometers of suburban, county, and rural roads in Alberta, Canada. This cutting-edge system, the first of its kind in Canada, employs step-frequency technology (100–3000 MHz) to achieve high-resolution imaging of thin pavement layers and deep subsurface targets (several meters), facilitating detailed structural analysis without disrupting traffic.
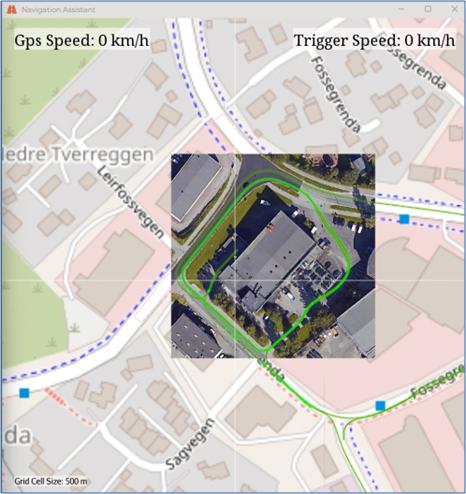
The system features a 2.1-meter-wide air-coupled antenna with 25 receiver channels spaced 7.5 cm apart, floating 50 cm above the ground. This design allows data collection at traffic speeds with minimal disruption. A sample interval of 10–15 cm ensures high-resolution data, geolocated using RTK GPS for precise alignment across swaths.
Conducted over five days, one pass per road segment (northbound or eastbound), covering ~100 km daily. The system identifies targets both inline and crossline to the collection path, eliminating the need for transverse scans. Dense data sampling reduces the number of confirmatory pavement cores needed.
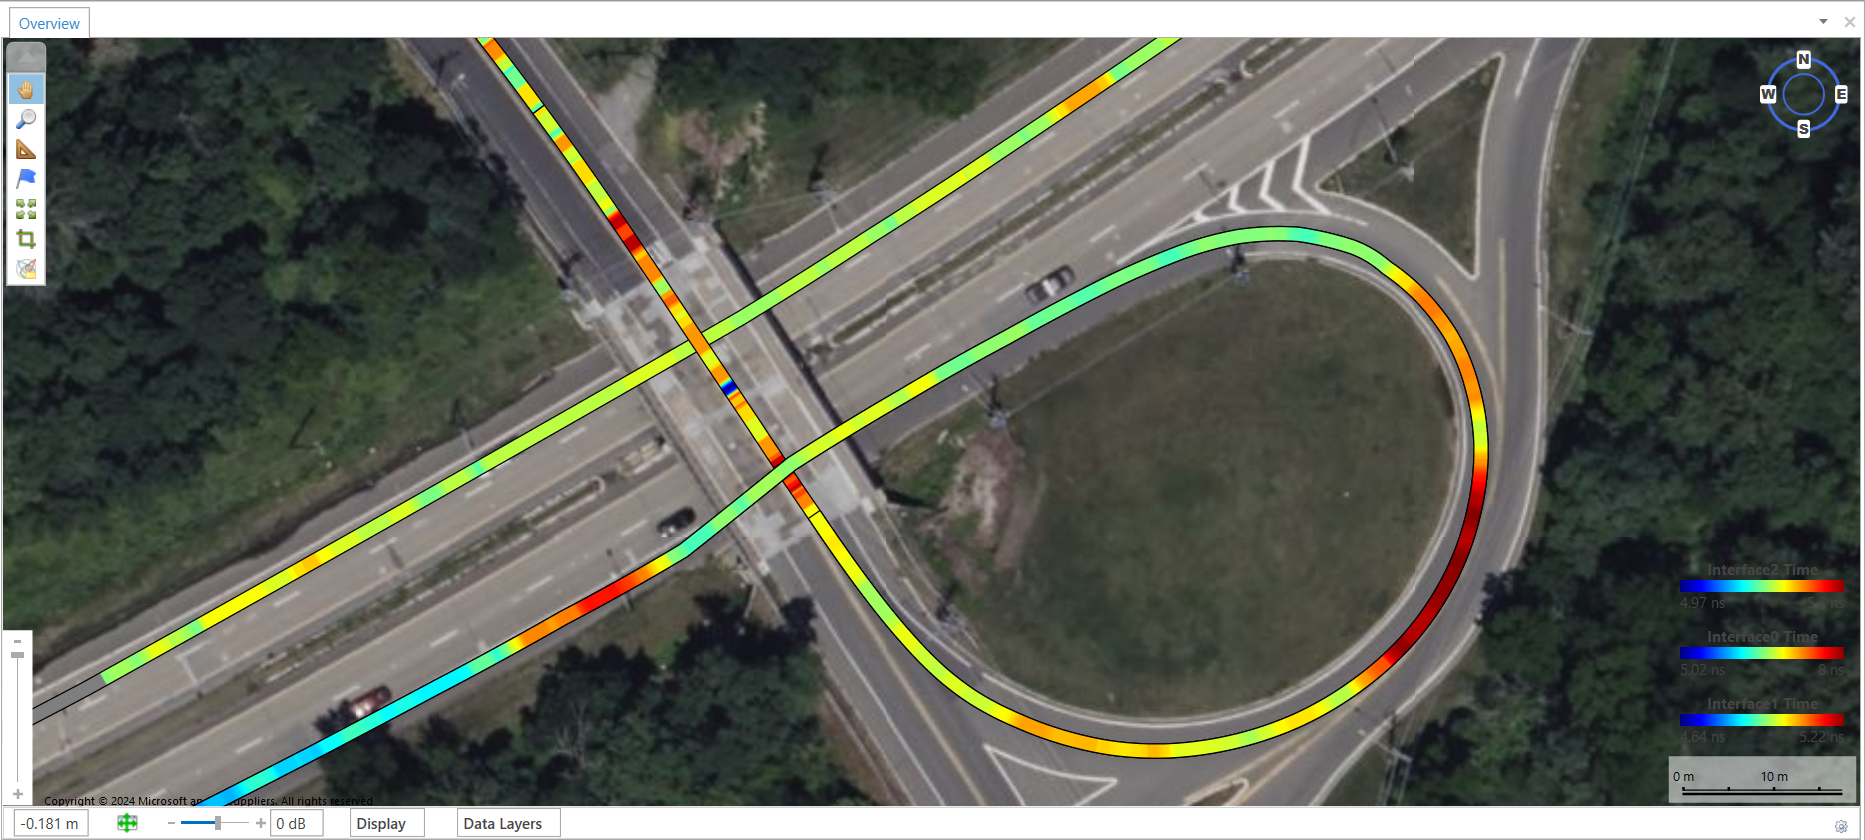
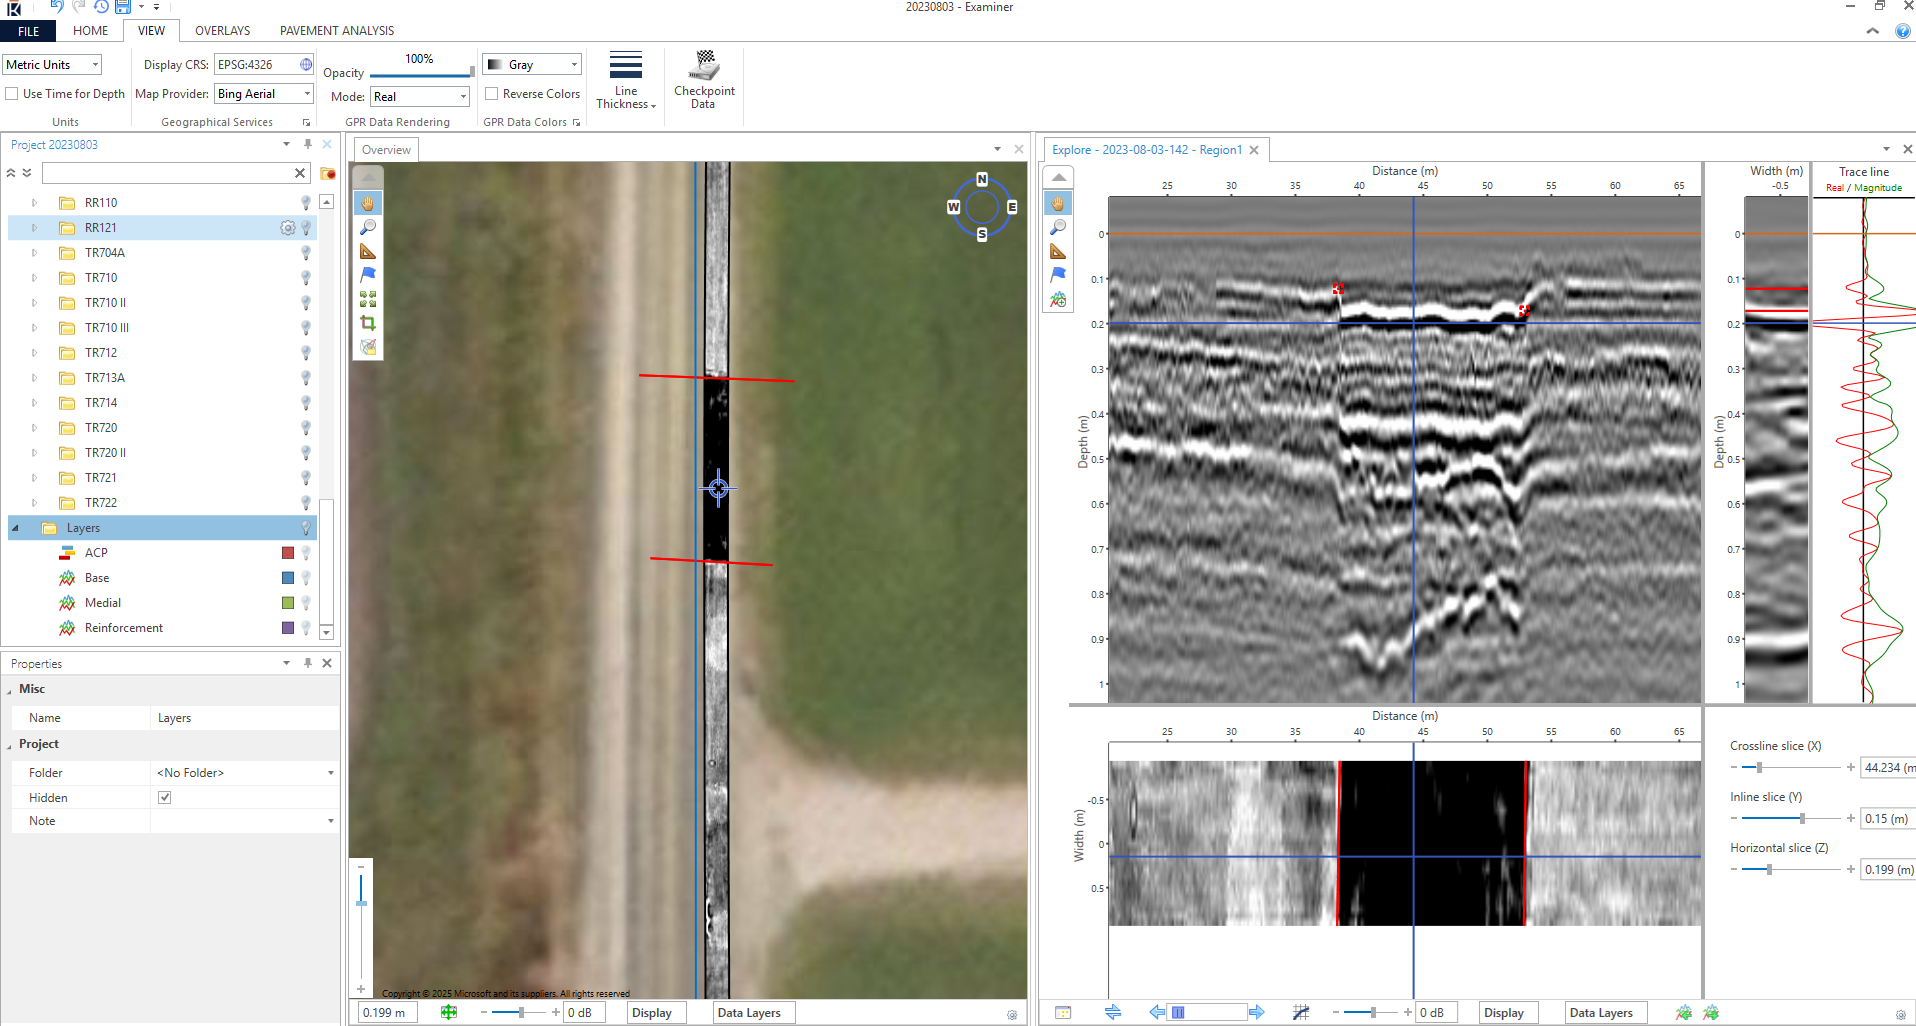
Performed using Kontur’s Examiner software, enabling rapid initial processing (even in the field), semi-automatic layer tracing, and calibration with core samples. Outputs include heat maps, geolocated tables, radargrams, and KMZ files, with statistical analysis identifying anomalies like delamination or voids.
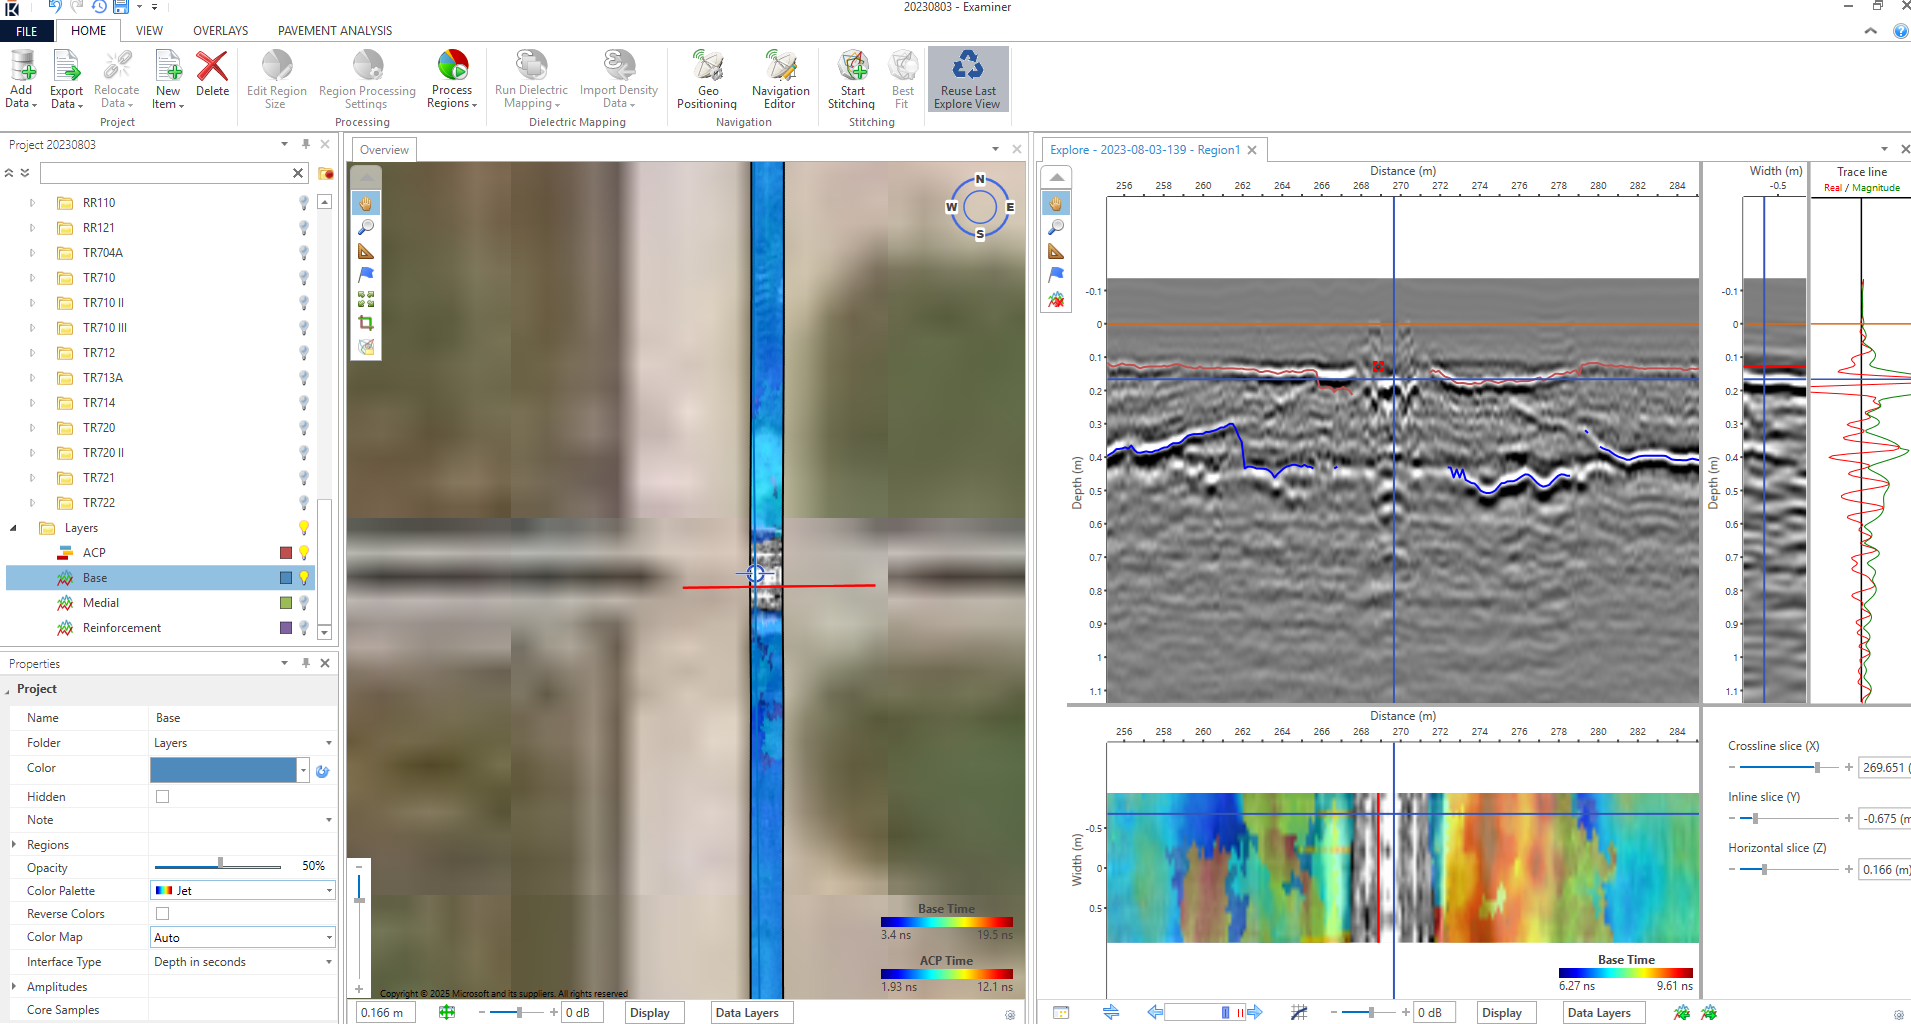
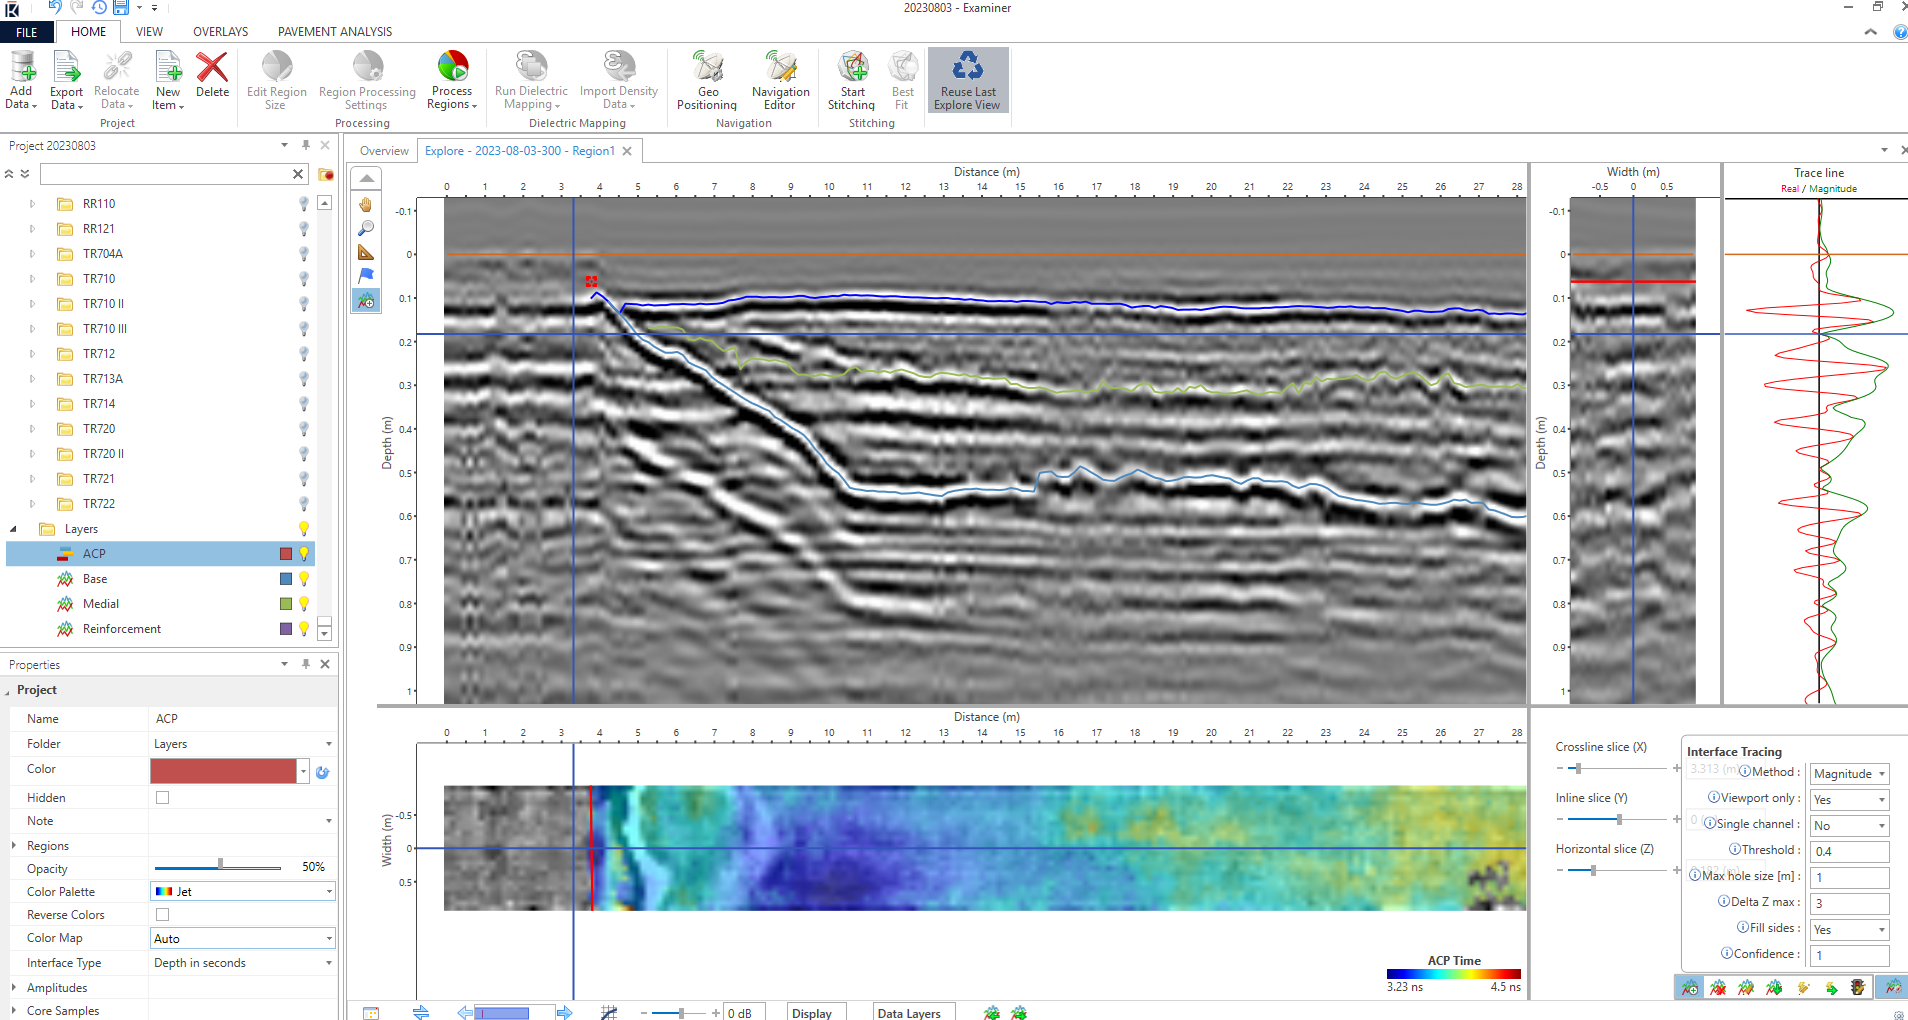
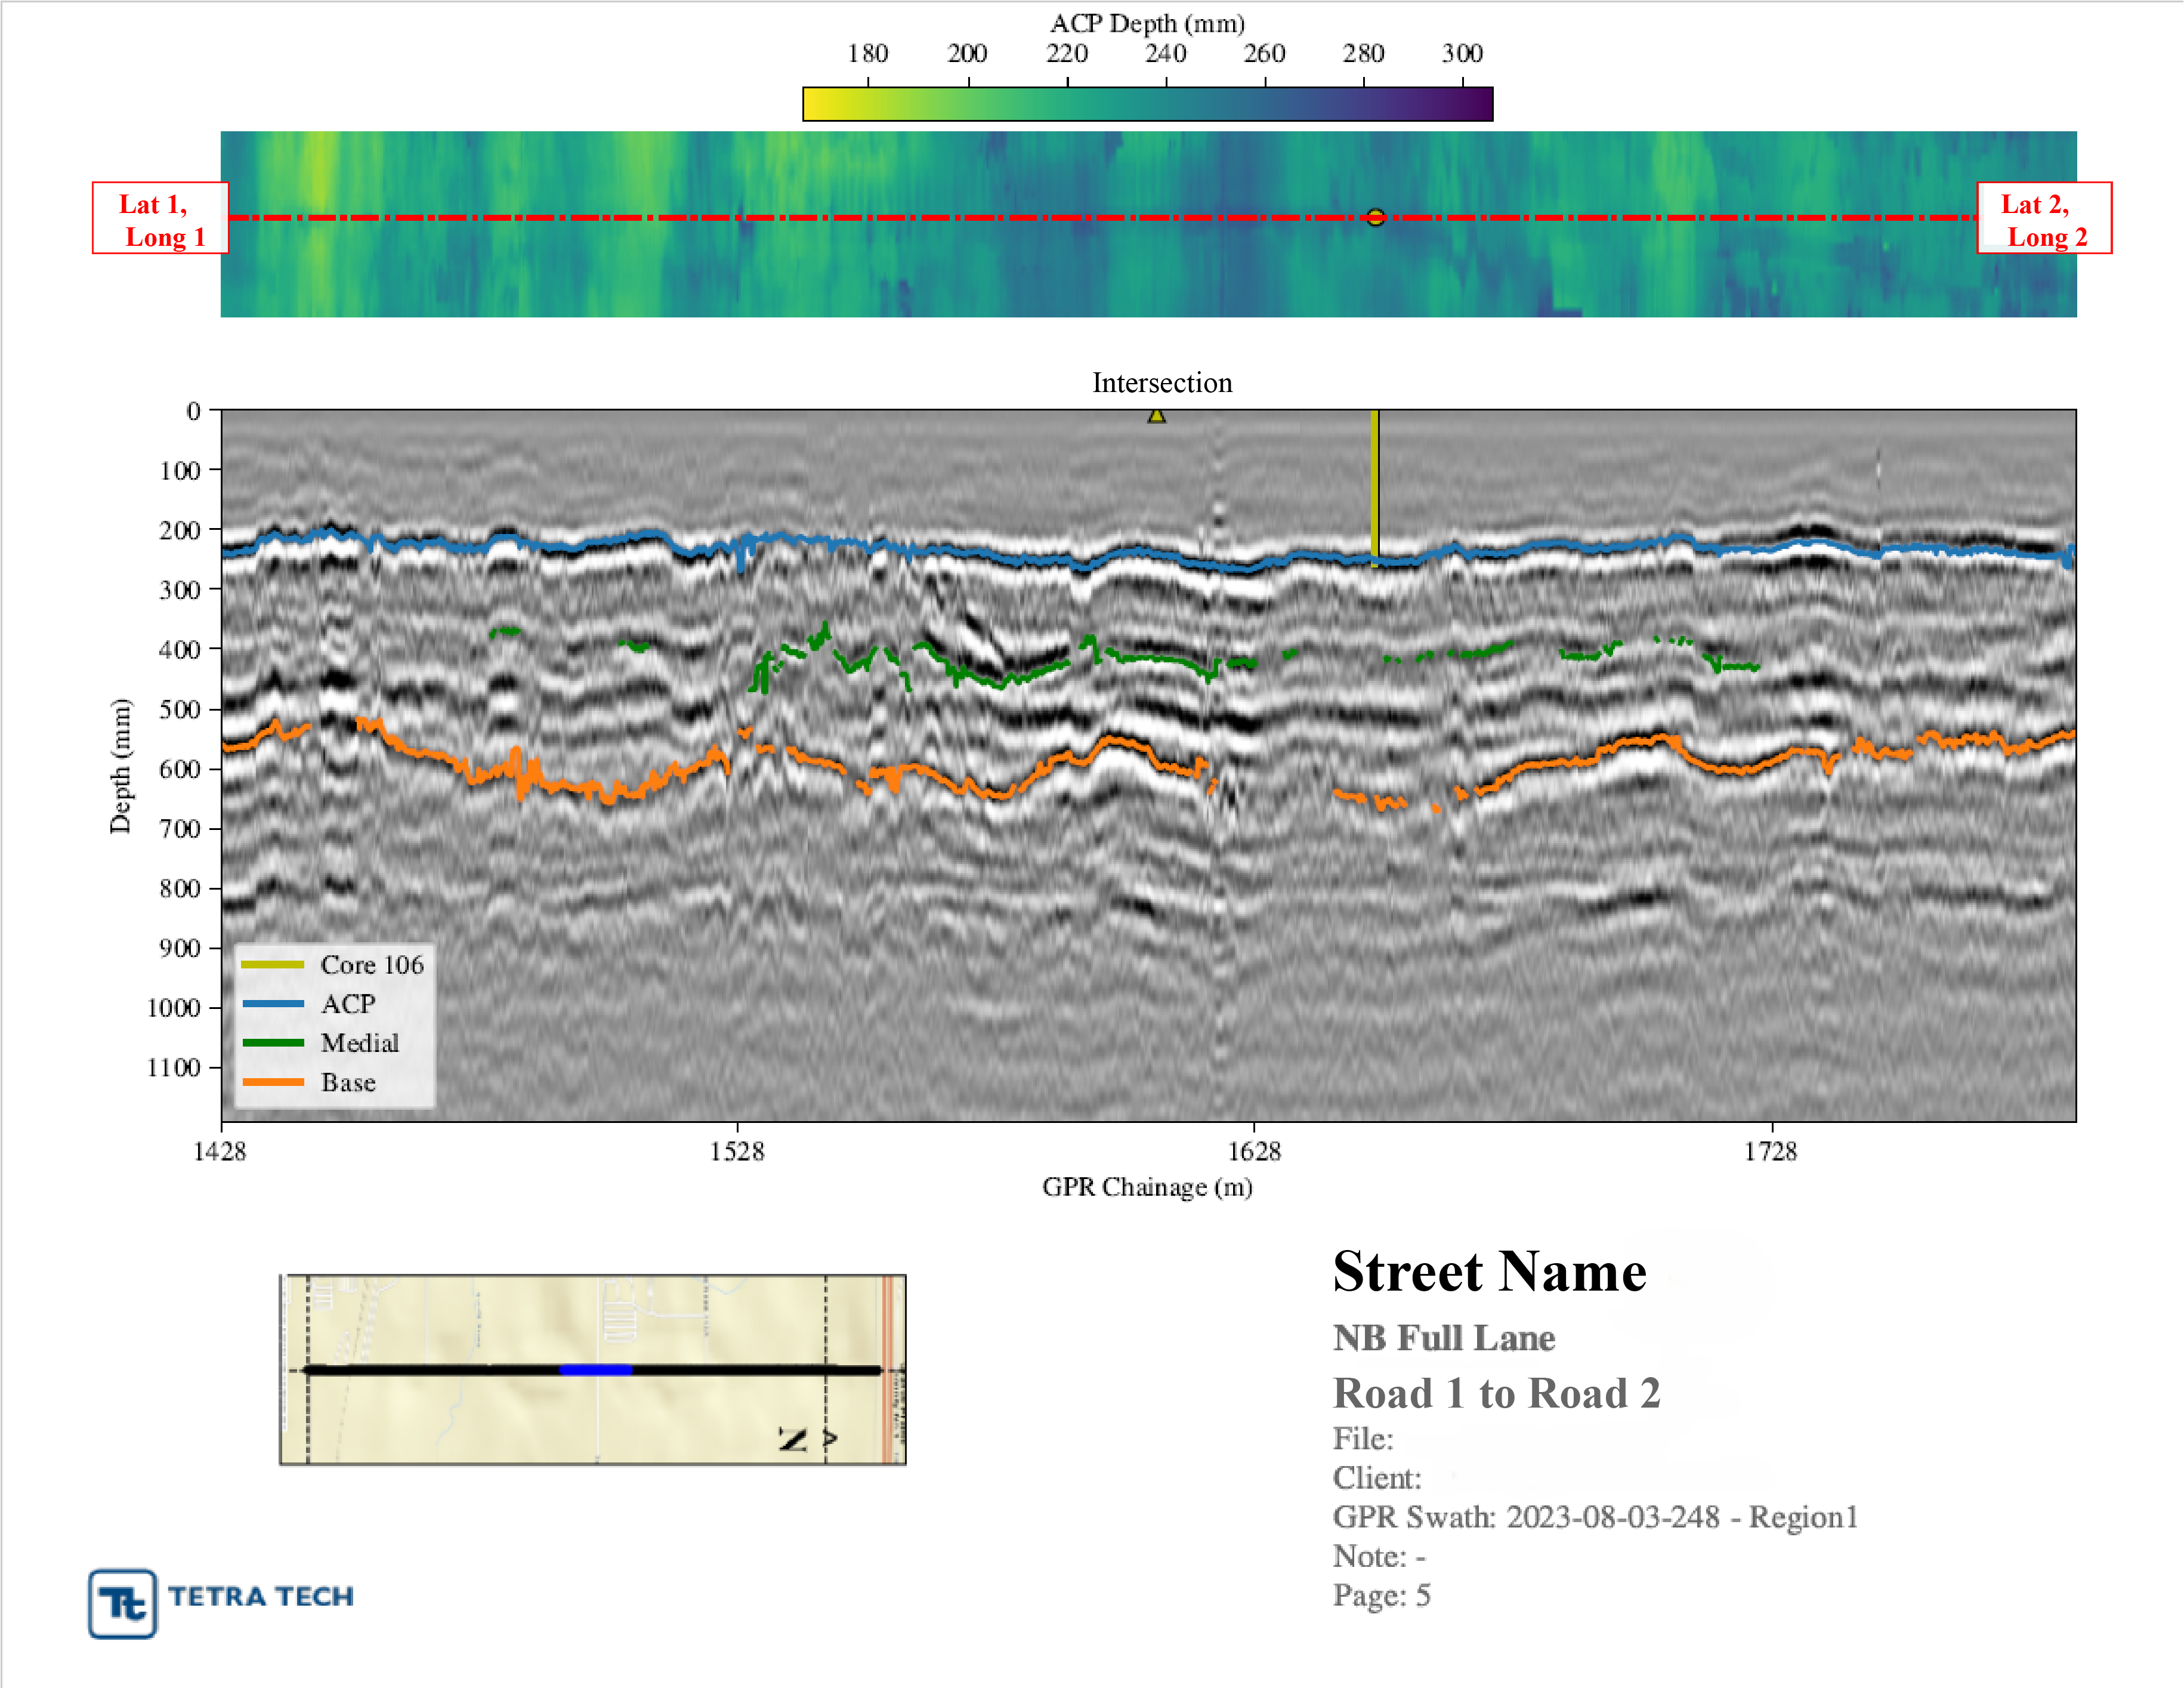
Show depth and distance scales with layer interfaces (e.g., ACP, Base) traced by colored lines (blue, orange), hyperbolic reflections indicating buried objects, and core locations (e.g., yellow bars at 1628 m chainage).
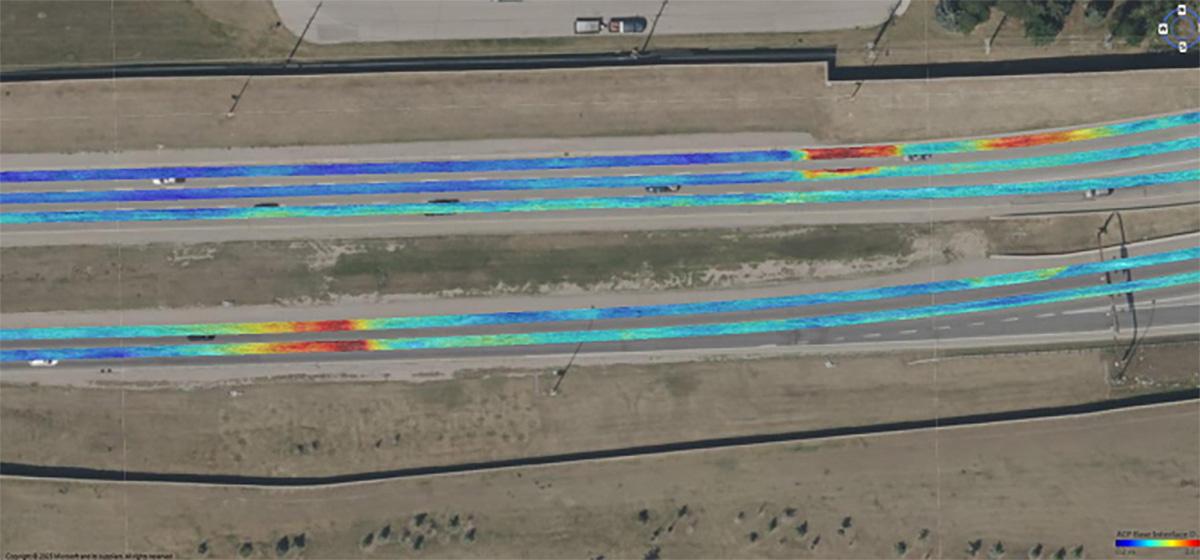
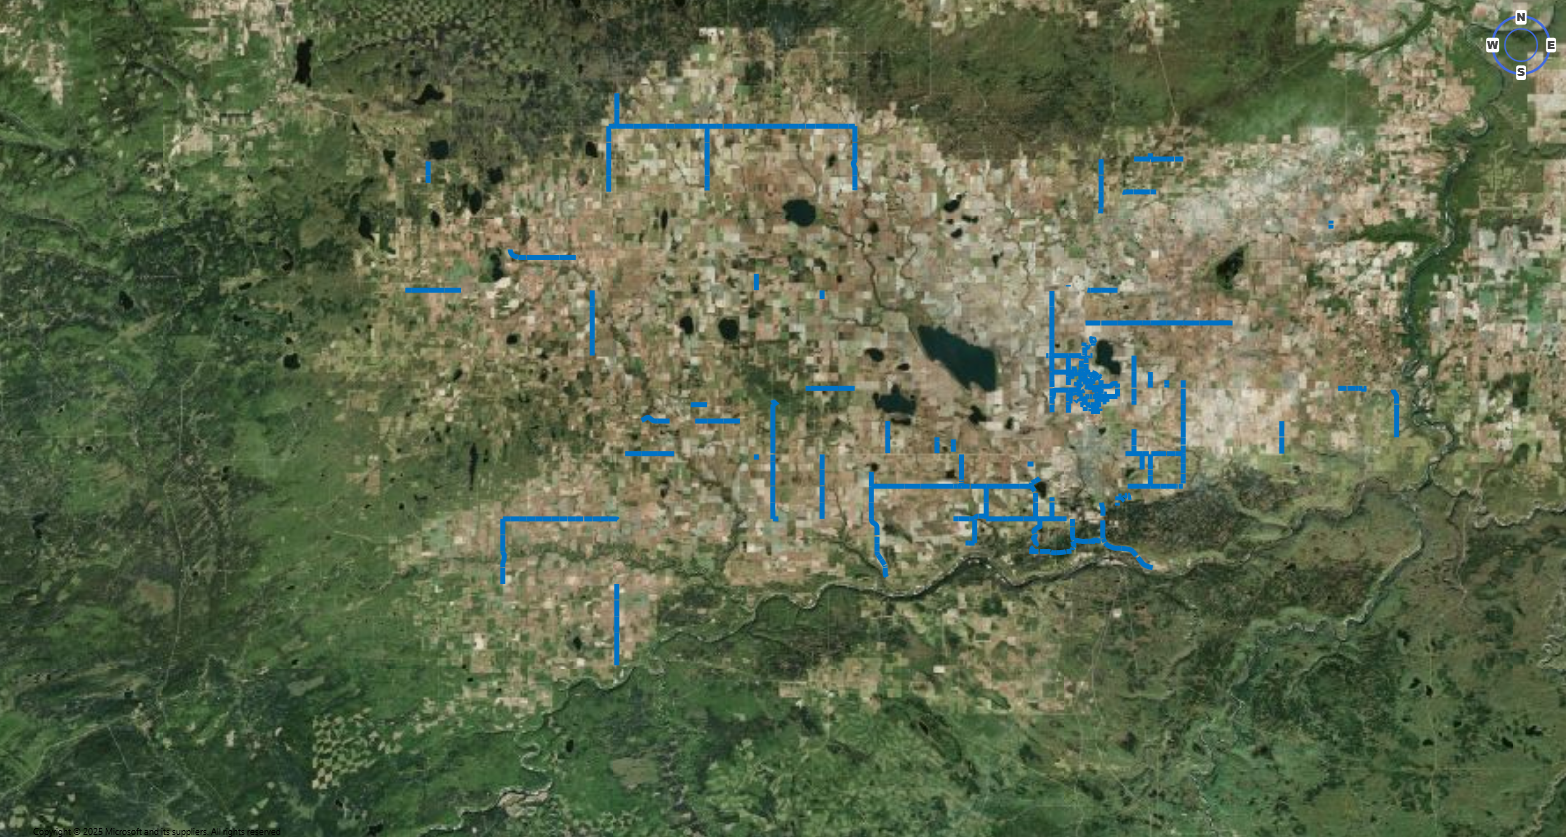
Color-coded ACP base interface depths (0.2–0.6 m), with red/yellow areas indicating deeper layers or anomalies across multi-lane roads, geolocated with swath annotations.
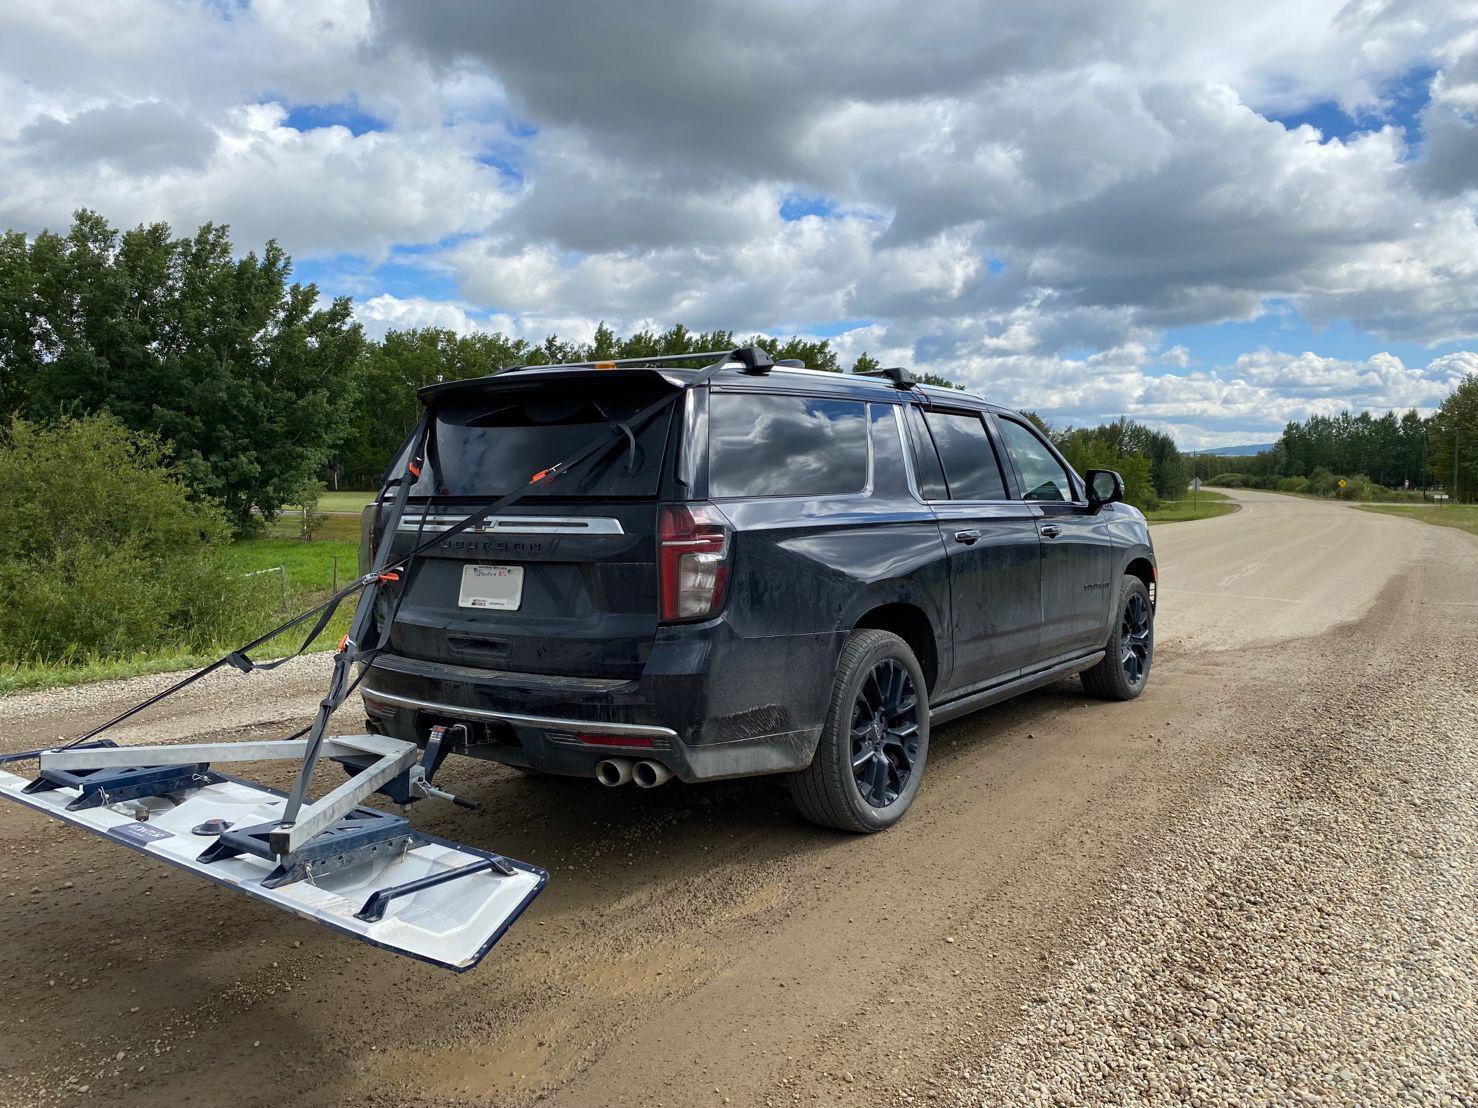
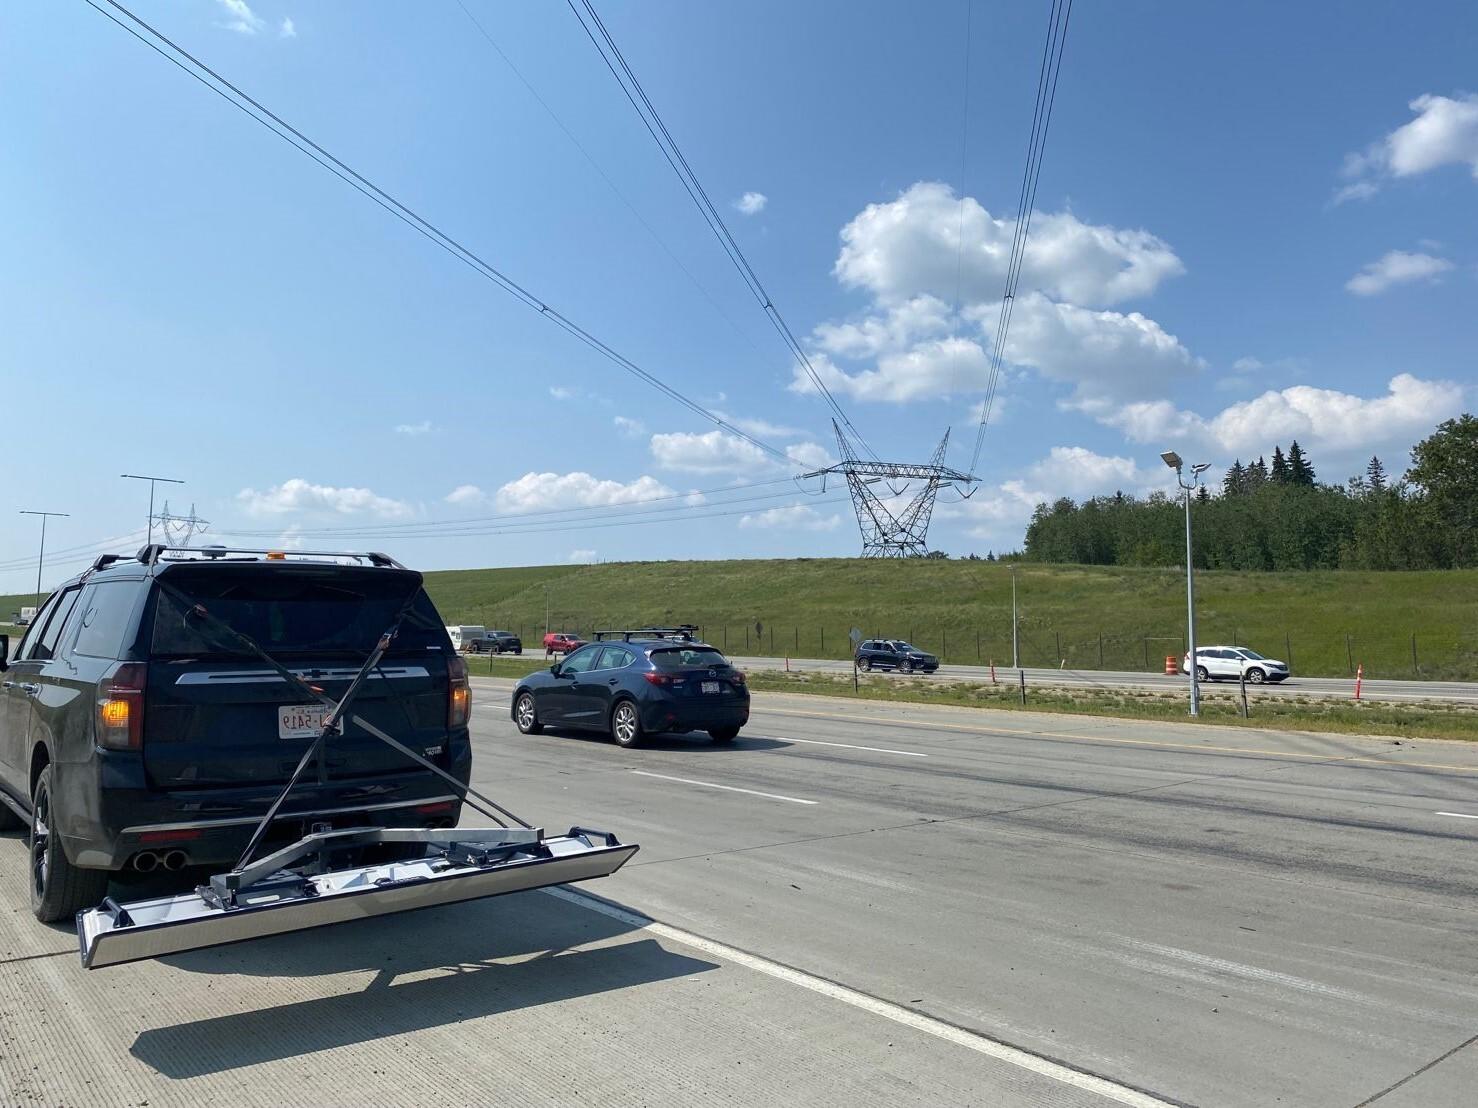
The Kontur system in action, towed by an SUV.
The Kontur 3D-Radar system provides a robust, non-destructive method to map pavement structures and detect subsurface anomalies across extensive road networks. Outputs reveal variable layer thicknesses (e.g., ACP from 180–400 mm), with deeper or irregular regions flagged for potential issues like delamination or voids, calibrated by cores and visualized in detailed reports.